From the packet on the wire to the number on the board
Two sensors, one console, eight views. This is what an analyst, an architect, and a board member each see — the same telemetry, read at the altitude each of them works at. Every screen here is the live product, captured as it runs.
Prefer to watch it? Three unedited demos live in Resources →
One platform · two sensors
Two sensors, one decision loop — one at the browser plane, one at the system plane. Neither sinks an agent into your endpoints.
| One decision loopCognitionAI Engine | ||
|---|---|---|
| Browser planeBrowser Sensor | System planeSystem Sensor | |
| Where it runs | In the browser session, in-page | In userspace, on native OS APIs |
| What it reads | Prompts · GenAI sessions · tool calls | Processes · agents · AI-created artifacts |
| Kernel surface | None — the extension runs in-page, not on the host | None — no driver, kernel extension, EDR hook or Ring 0 |
| Privilege required | None beyond the extension | No root, no administrator |
| Platforms | Chrome · Chromium · Edge · Safari | Windows · macOS · Linux |
| Where it acts | At the point of interaction | At the point of execution |
Multi-persona views · one console
From the packet on the wire to the number on the board — every layer of the user edge, in one place.
- 01 · See
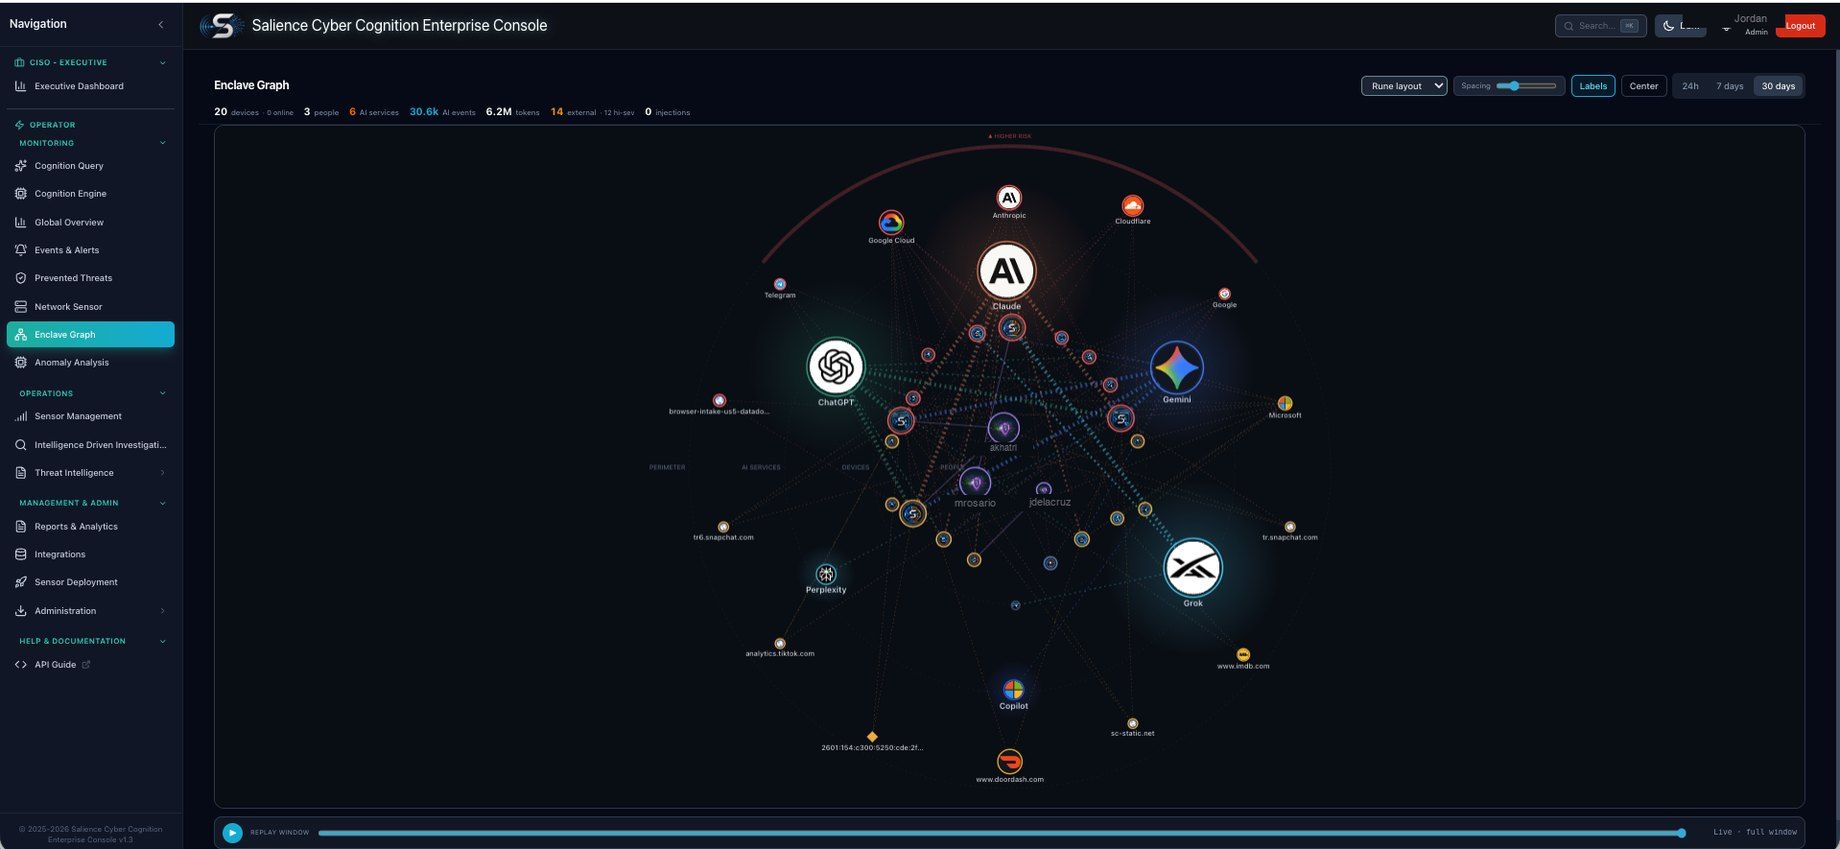
Live AI Traffic Topology
AI services, devices, people and external destinations drawn as one continuously updating map — sanctioned AI and shadow AI side by side. - 02 · Attribute
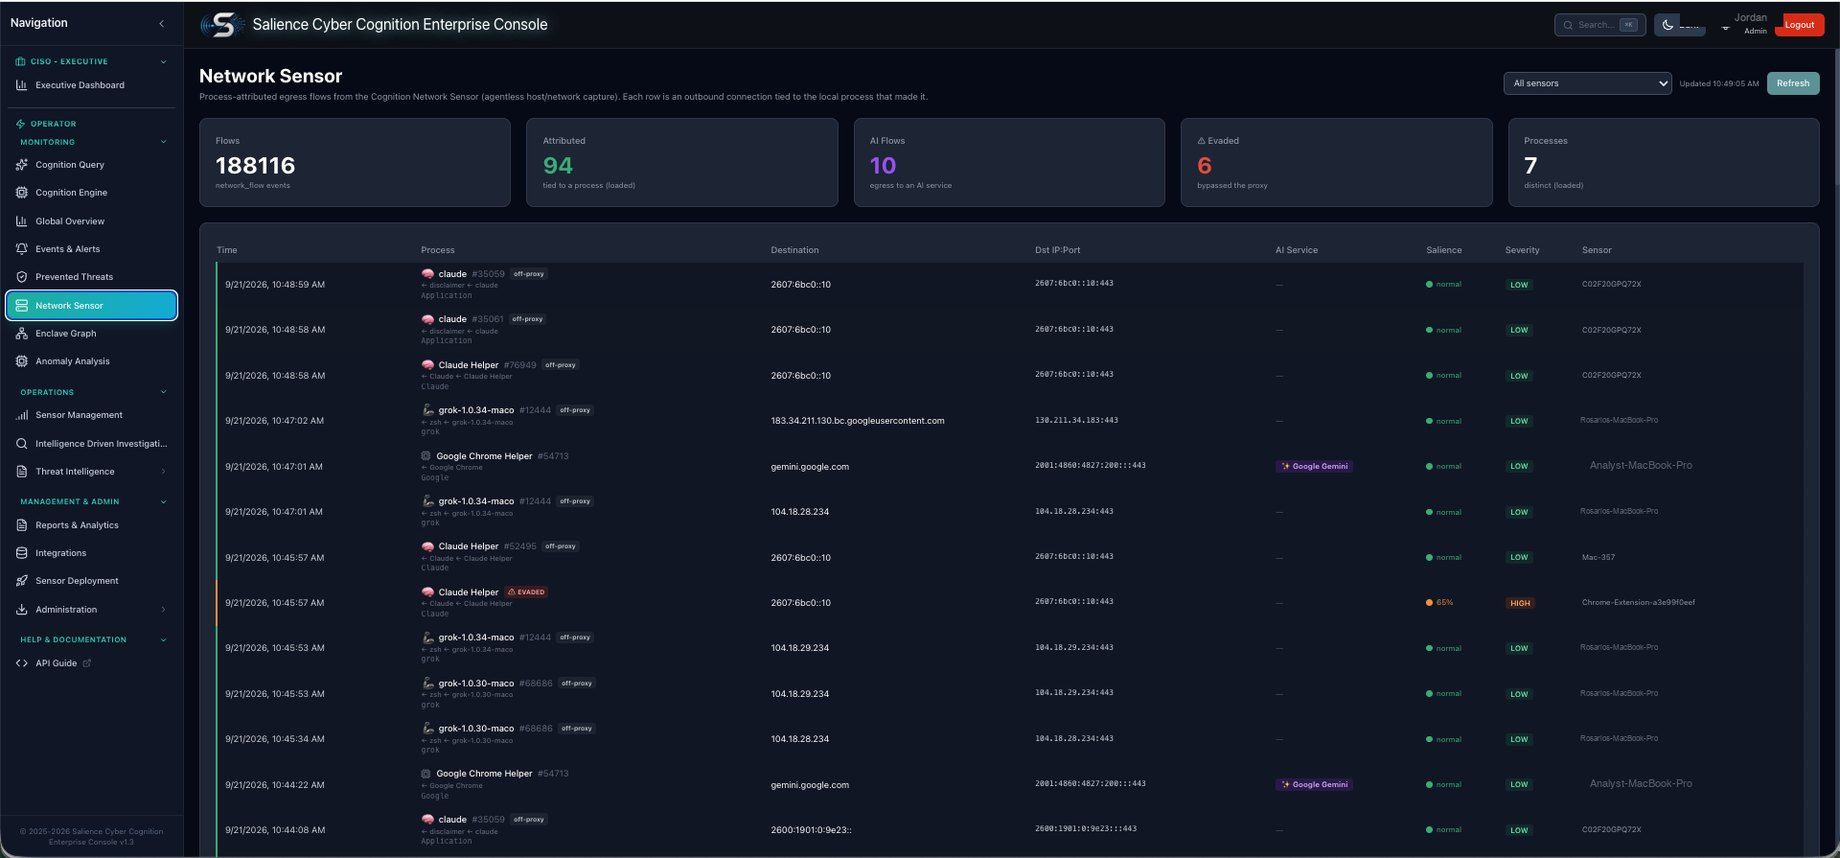
Flow-to-Process Attribution
Every outbound connection tied to the local process that opened it — and the ones that bypassed the proxy counted out on their own. - 03 · Comprehend
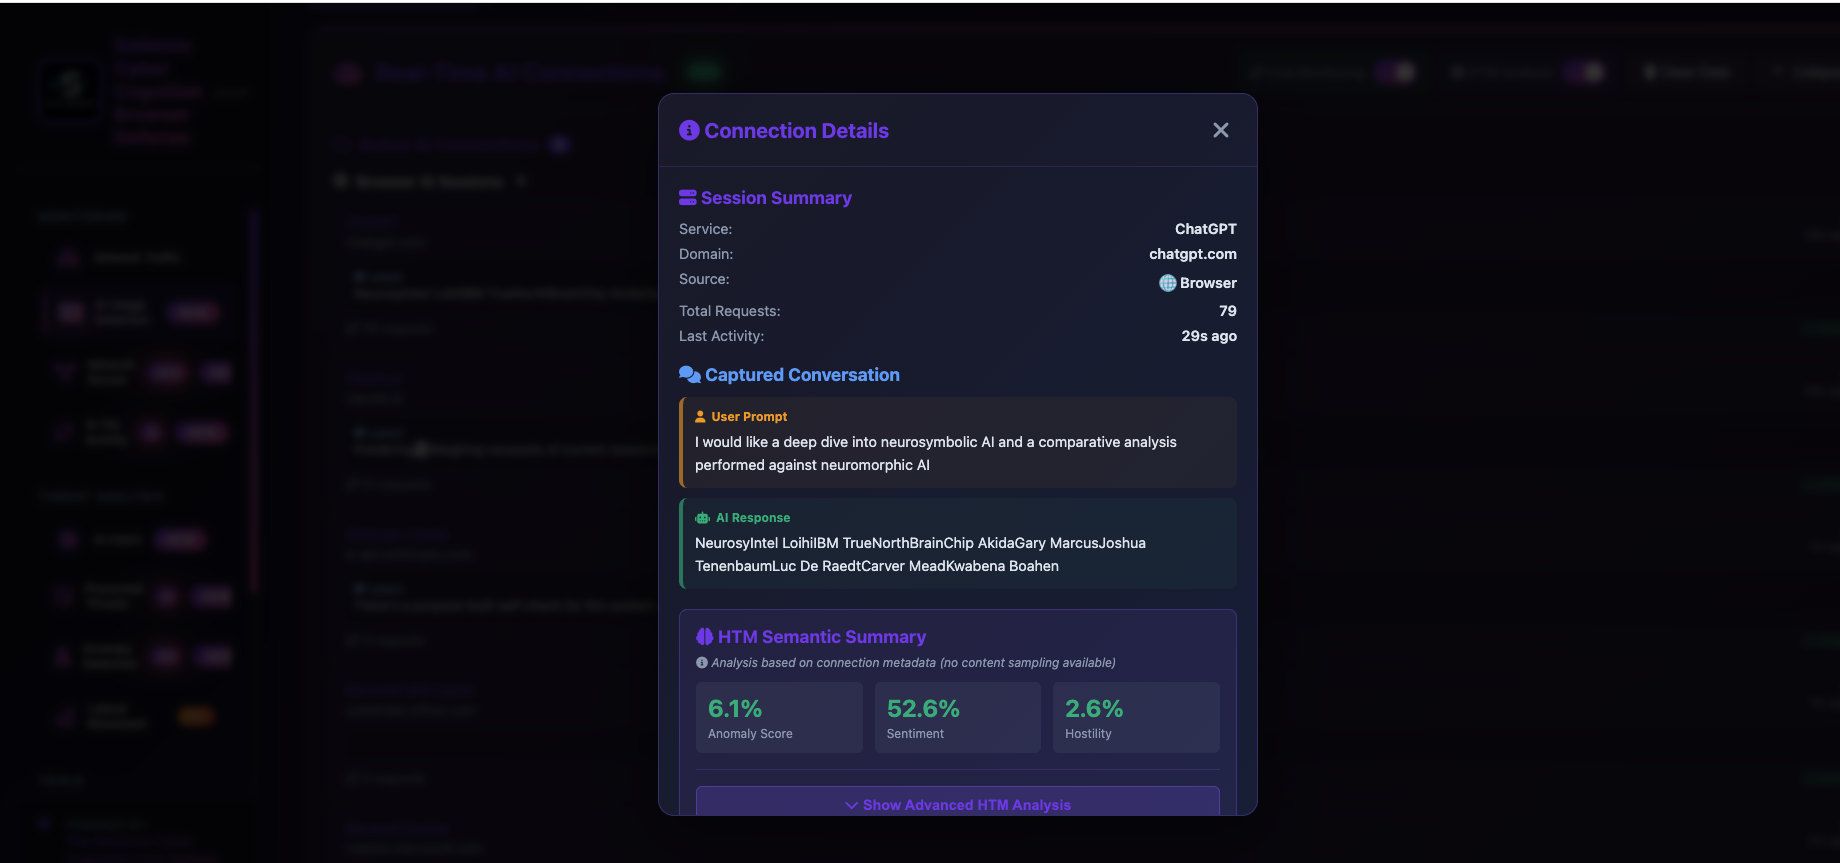
Intent Inside the Interaction
The captured exchange, scored for anomaly, sentiment, and hostility — read at the semantic layer rather than matched against a signature. - 04 · Verdict
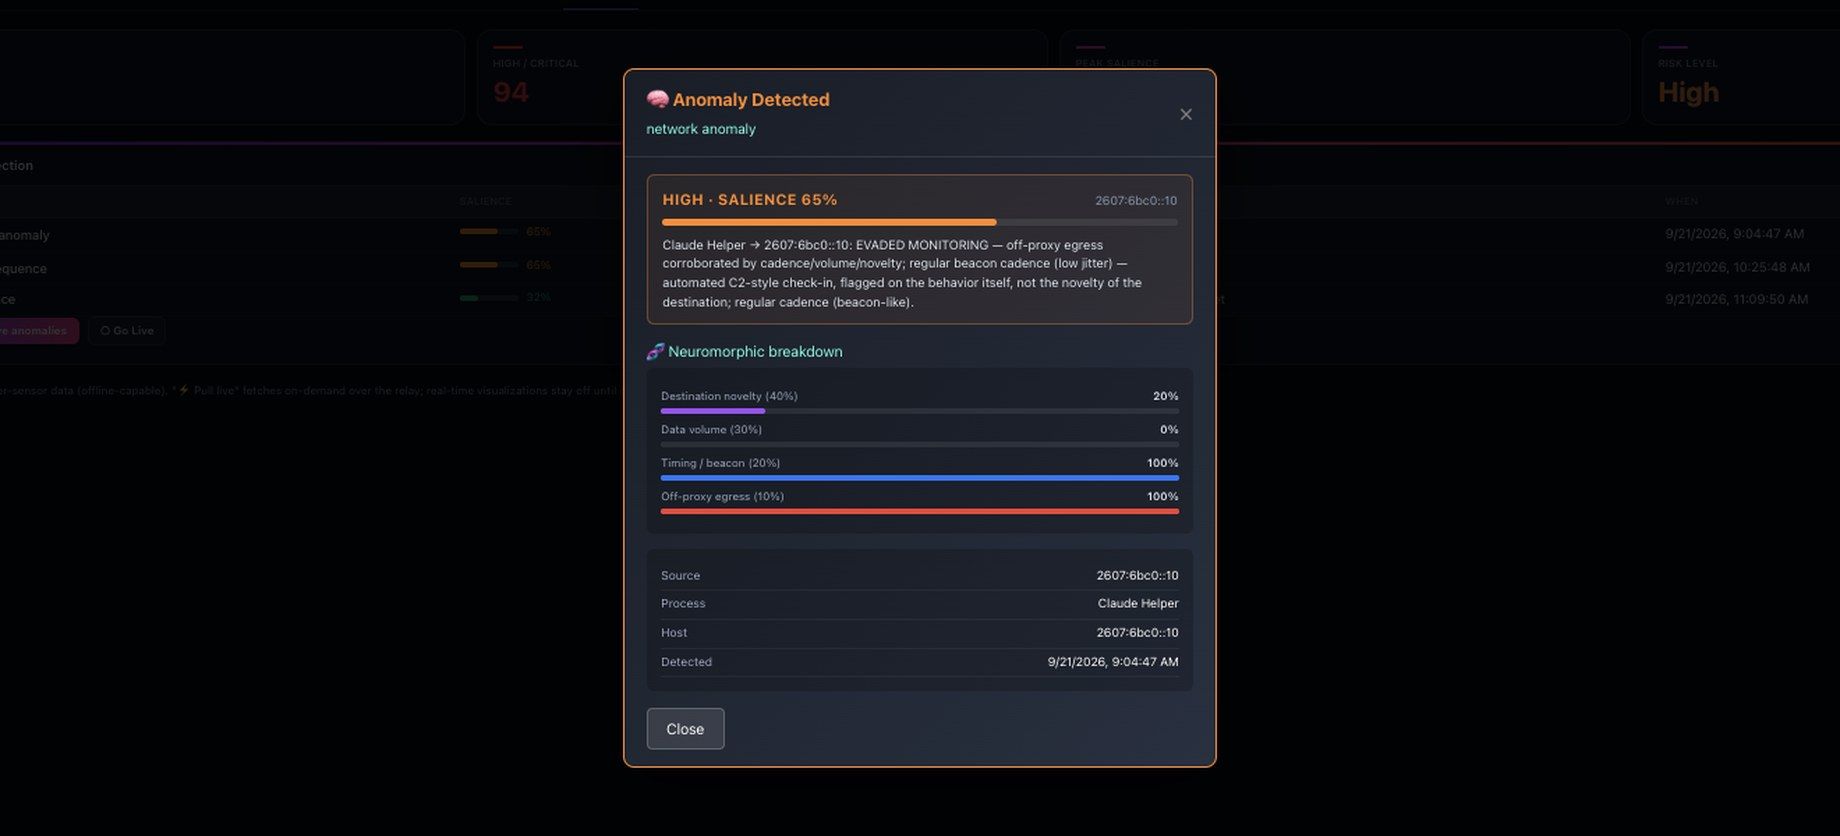
The Drivers Behind the Score
One salience score per flow, broken into the weighted signals that produced it — destination novelty, data volume, timing, and off-proxy egress. - 05 · Evasion
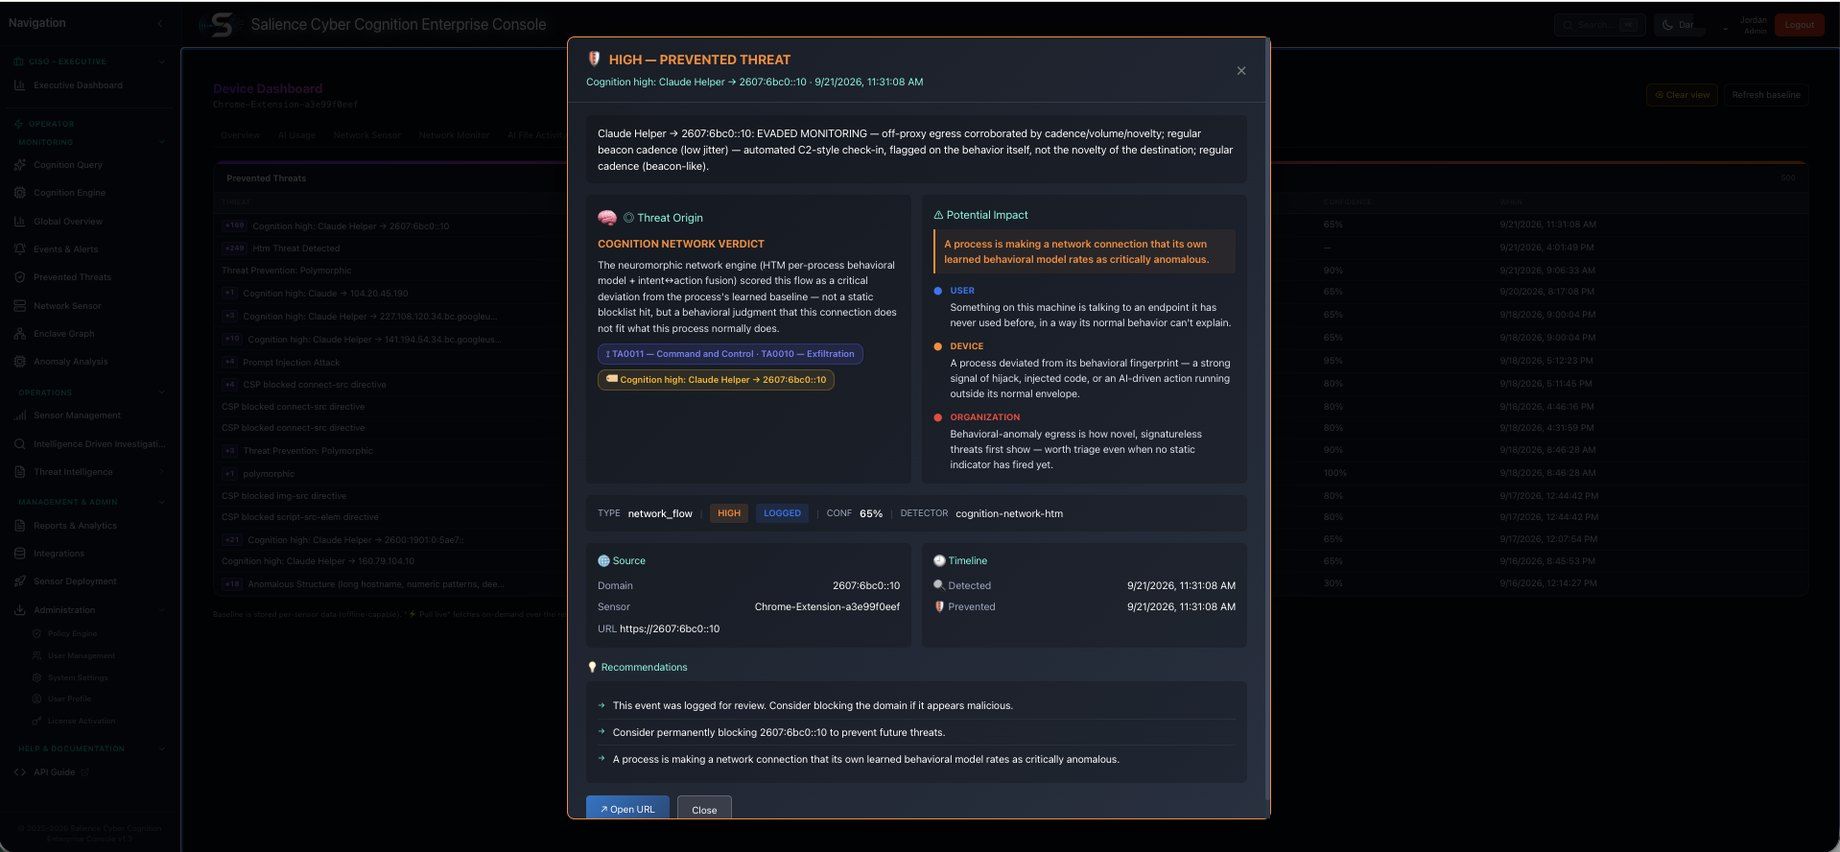
Caught Going Off-Proxy
A process that routed around monitoring — with the behavioural reasoning, the ATT&CK mapping, and the impact stated in one panel. - 06 · Provenance
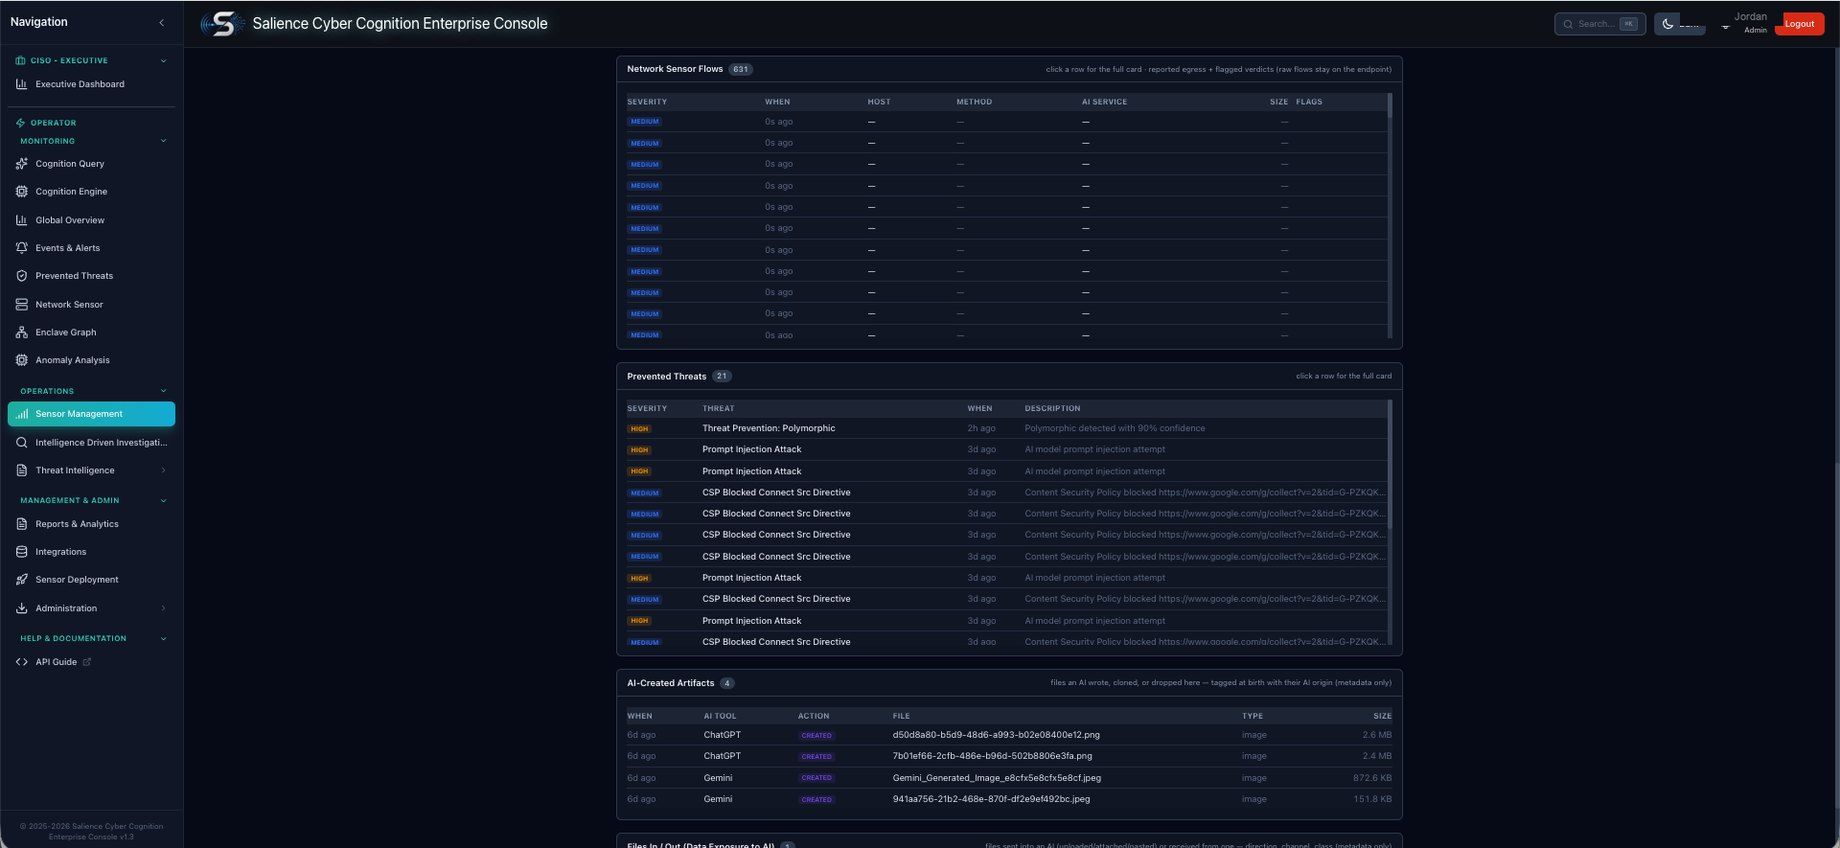
Files Traced to the AI That Made Them
Every AI-created artifact recorded at birth — so if it ever executes, the egress is already tied to the session that wrote it. - 07 · Enforce
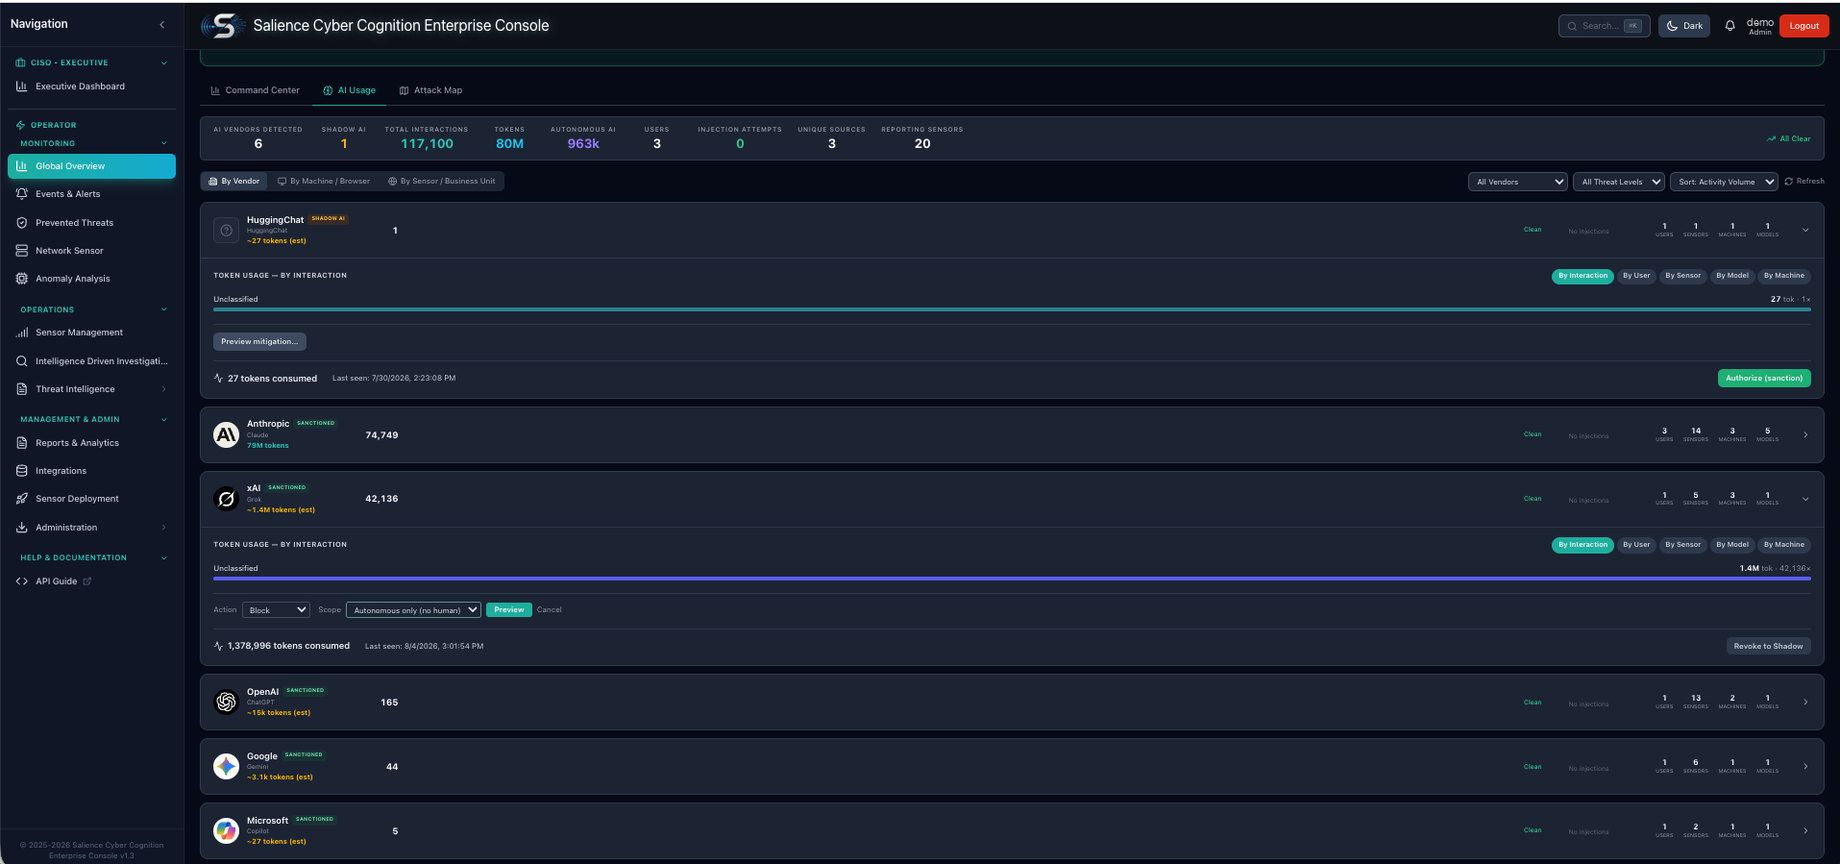
Shadow AI, Sanctioned or Blocked
Vendor-by-vendor usage with sanction and revoke — and enforcement scoped to autonomous activity, leaving human workflows untouched. - 08 · Board
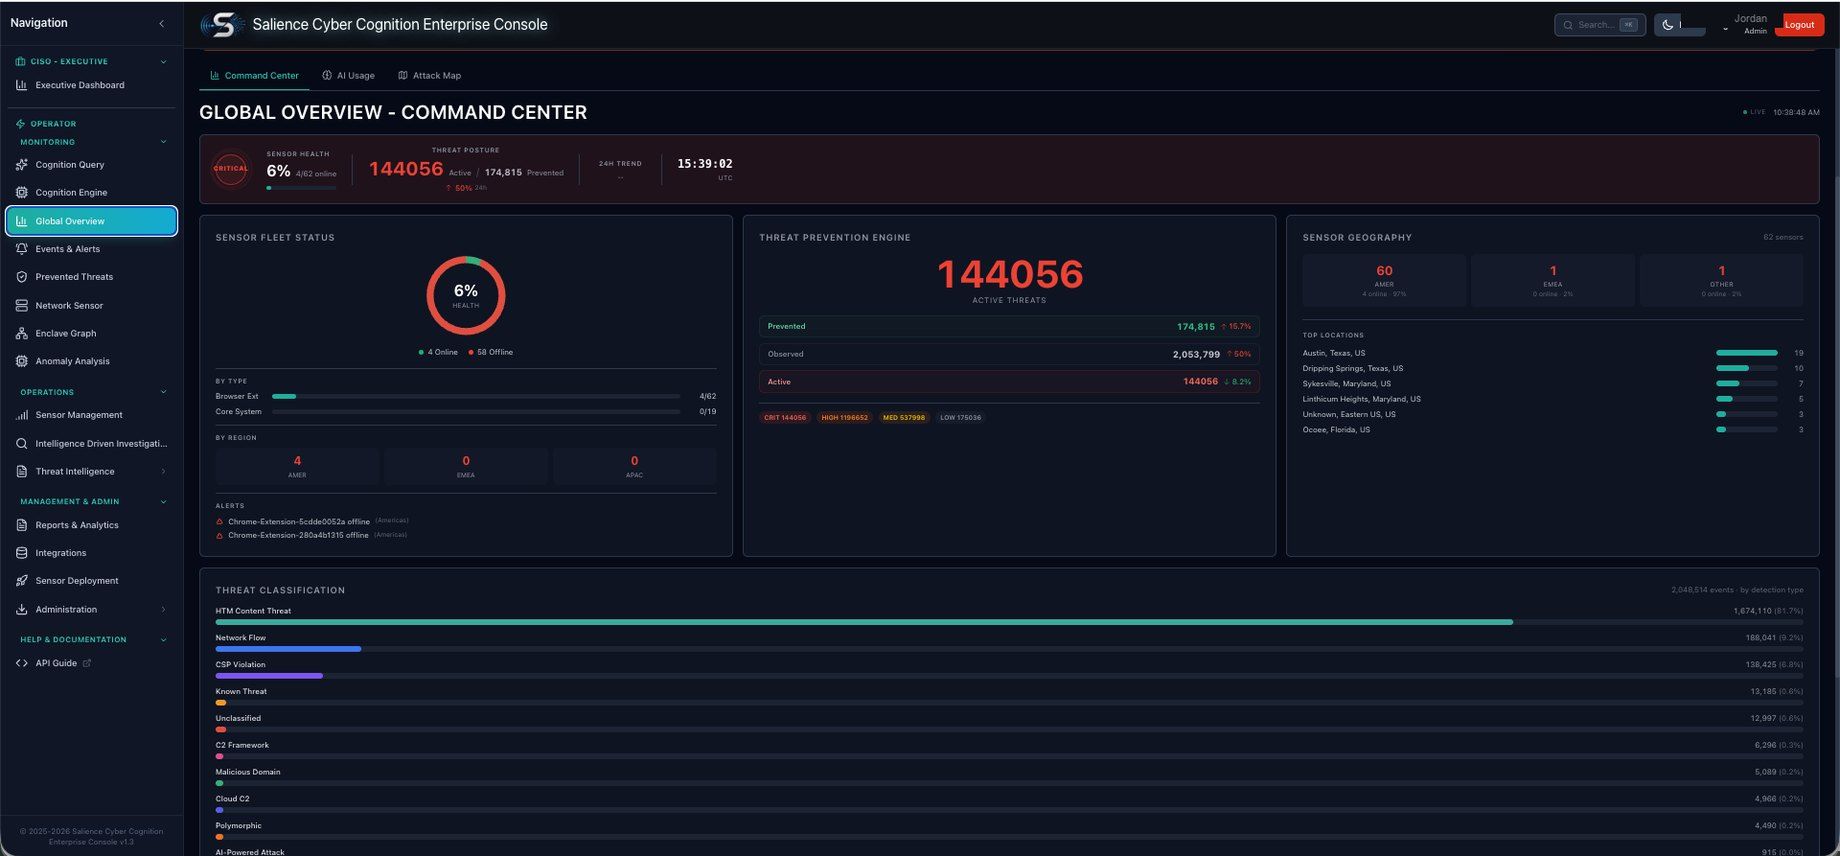
The Number on the Board
Fleet health, prevention posture, and global threat distribution — the same telemetry, in the language of the board.
Bring it to your own environment.
Your traffic, your AI tools, and the same console you just toured — walked through live with an engineer.